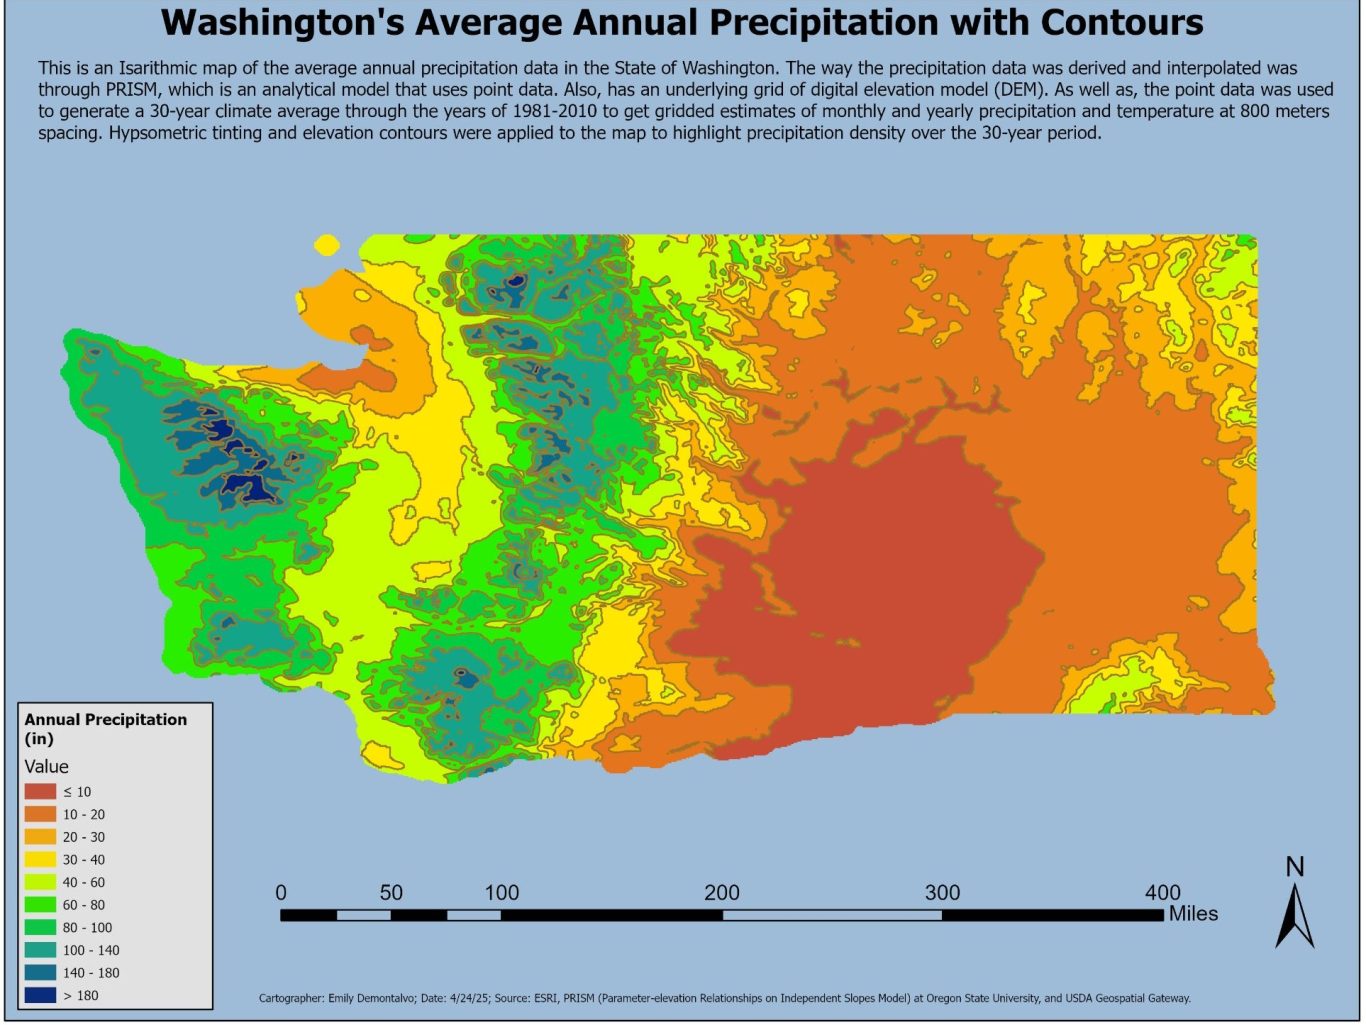
Average Annual Precipitation in Washington State
Using isarithmic geoprocessing tools in ArcMap, this map uses hypsometric tinted DEM data to display rainfall in Washington State.
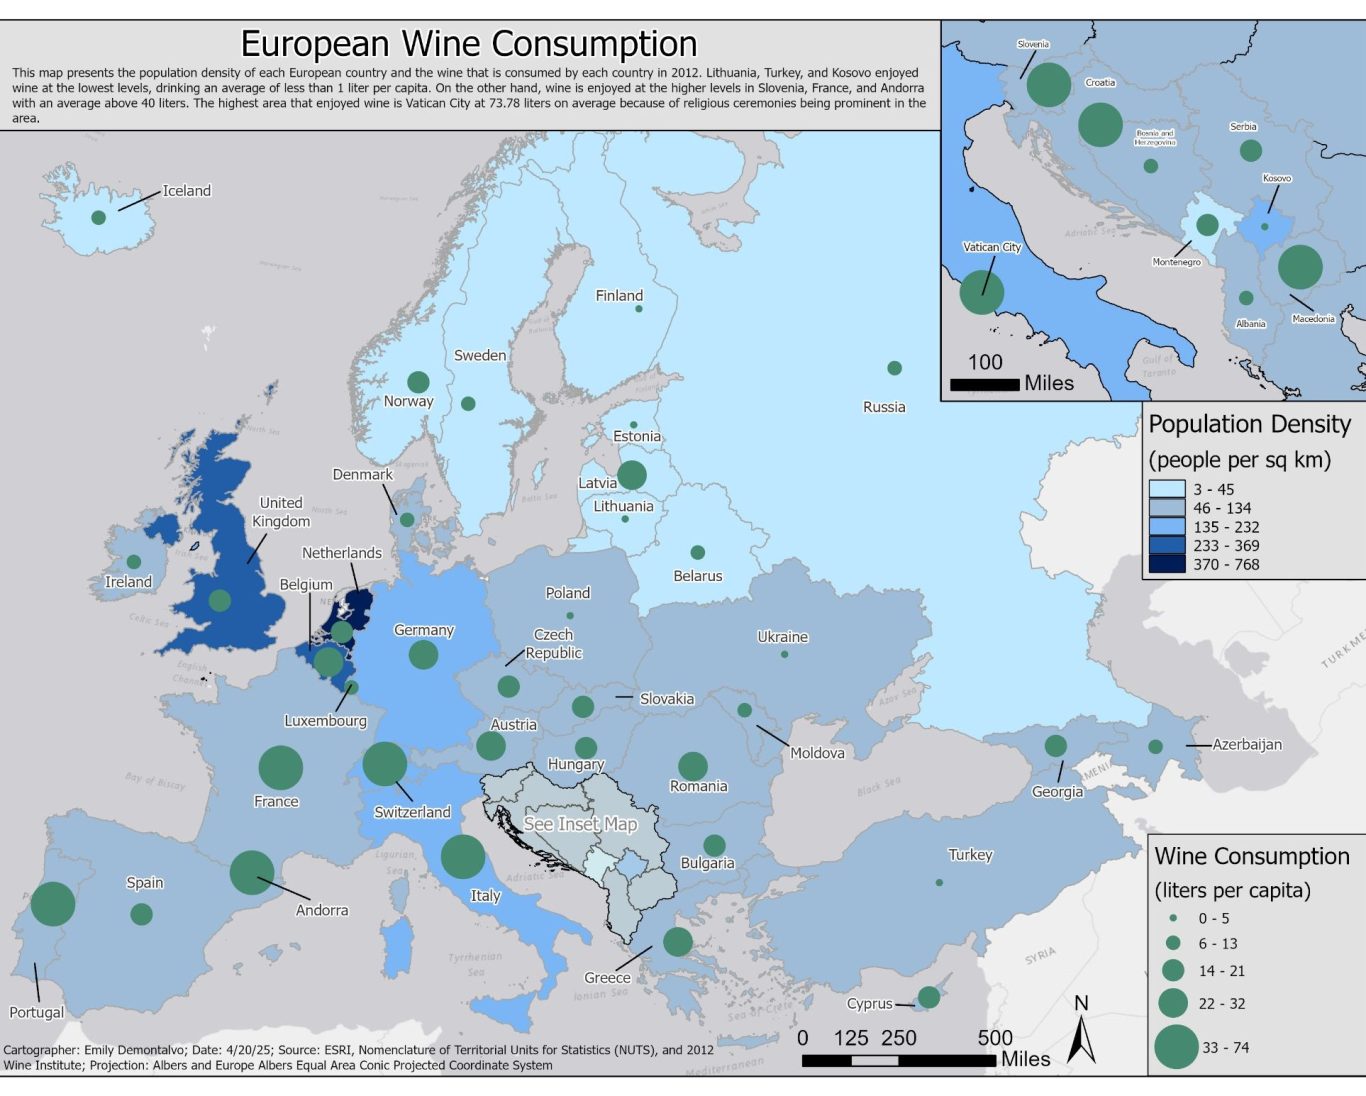
Wine Consumption Across Europe
A combined choreopleth and proportional symbol map depicts population and wine consumption across Europe.
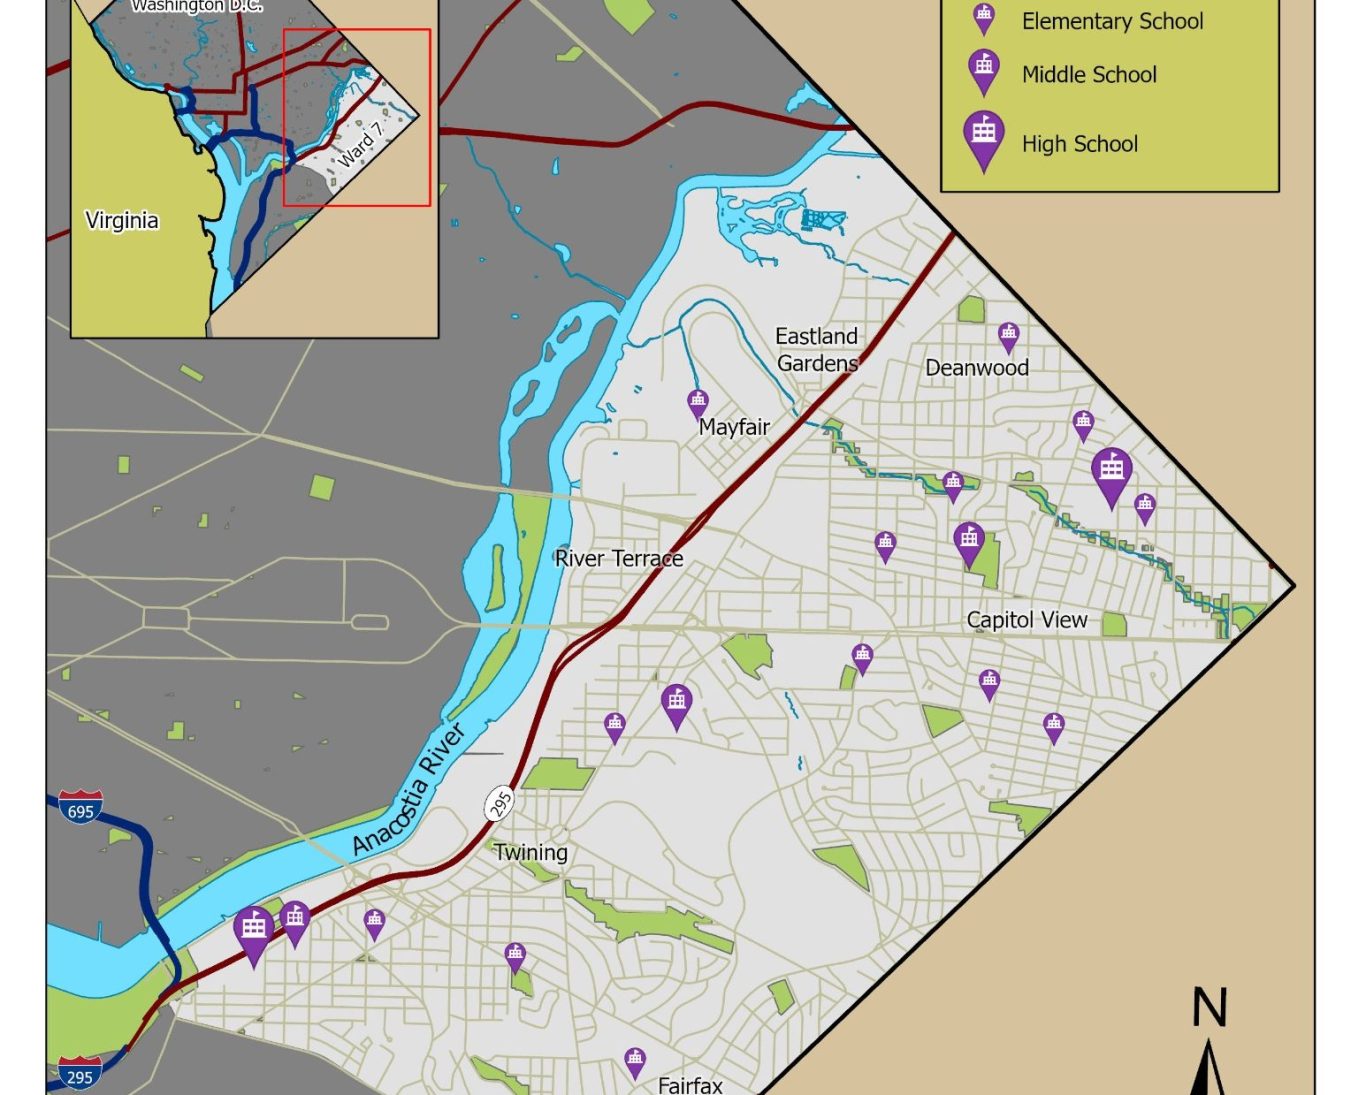
Public Schools in Washington D.C.
This map uses proportional symbols to depict both the distribution and types of schools in Washington D.C.
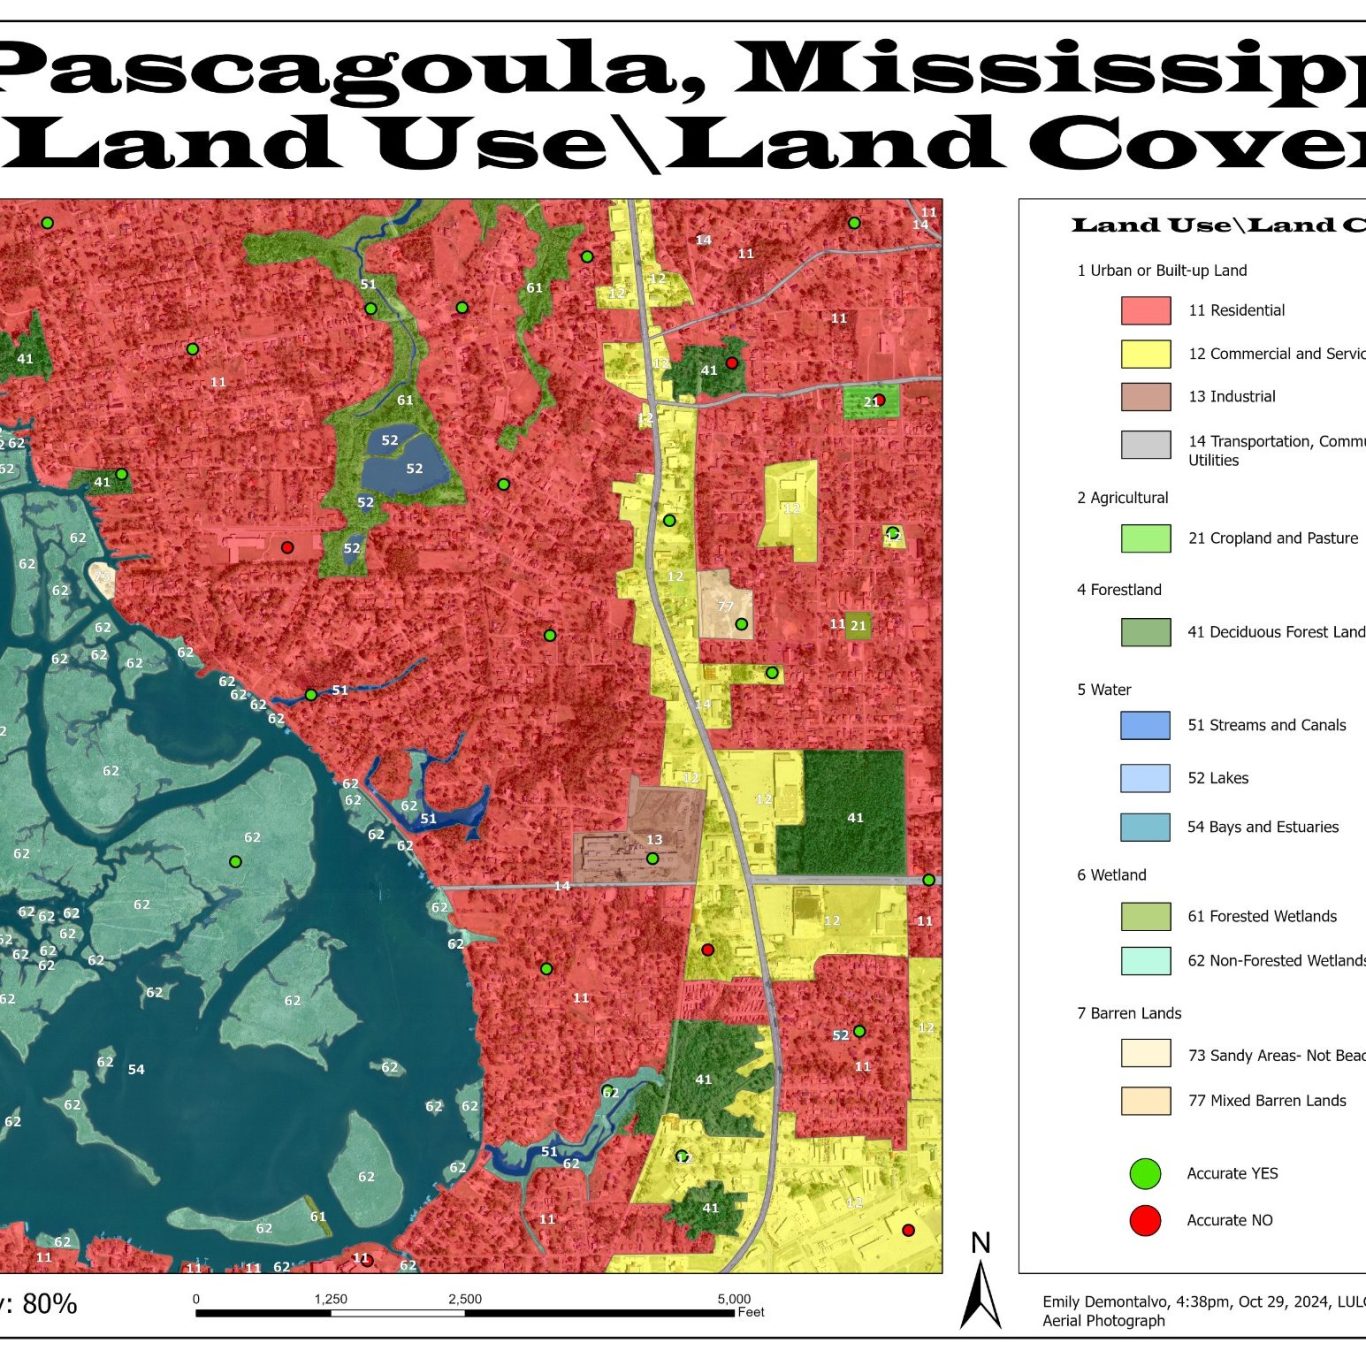
Land Use/Land Cover
Creating a Land Use/Land Cover (LULC) map for Pascagoula, MS and trying to ground truth the accurcary from a distance.
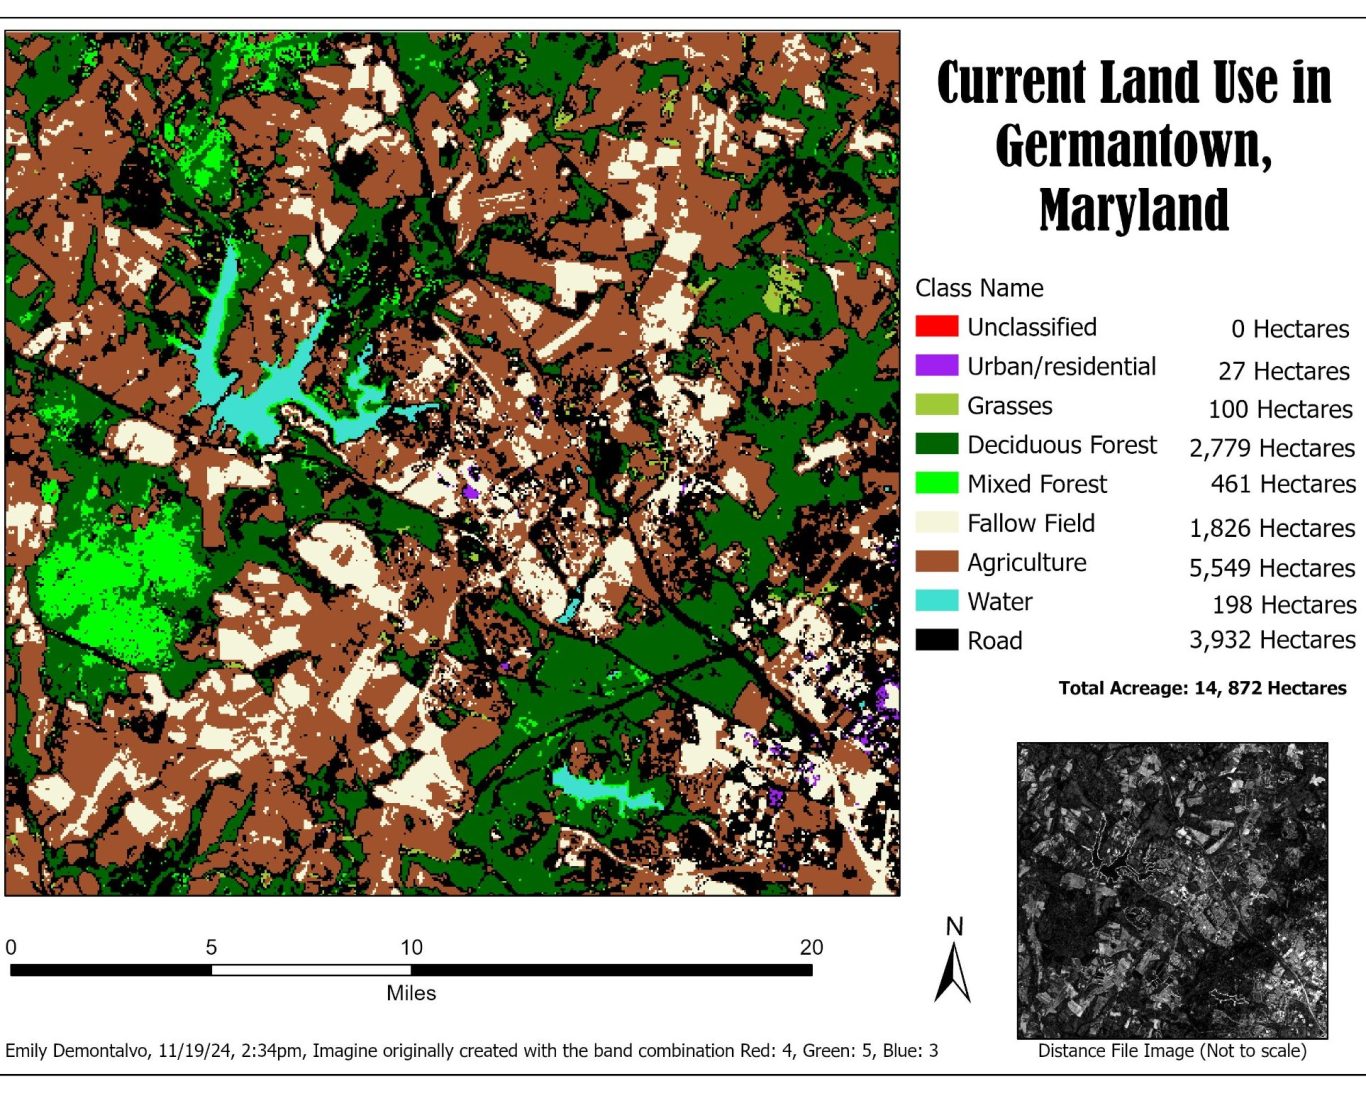
Unsupervised and Supervised Classification
Image classification is the process of giving discrete and unique values to all pixels in a raster image. These values represent certain features in the image, such as land use/land cover types, and are based on the color of the original image pixels. A classified image is a thematic raster file, contains an attribute table, and occupies much less storage space than the original image file. Classified images can be used for a variety of applications that are not available for standard image files.
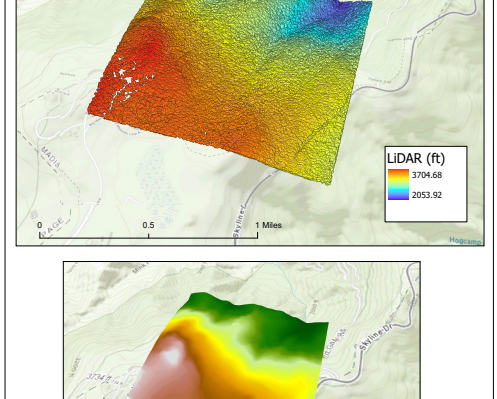
Forestry and LiDAR
LiDAR, or light detecon and ranging, data is useful to foresters to understand the forest canopy and terrain. This helps with the forest management and operaonal acvies such as forest health analysis, calculate forest biomass, classify terrain, idenfy drainage paterns, and plan forest management.
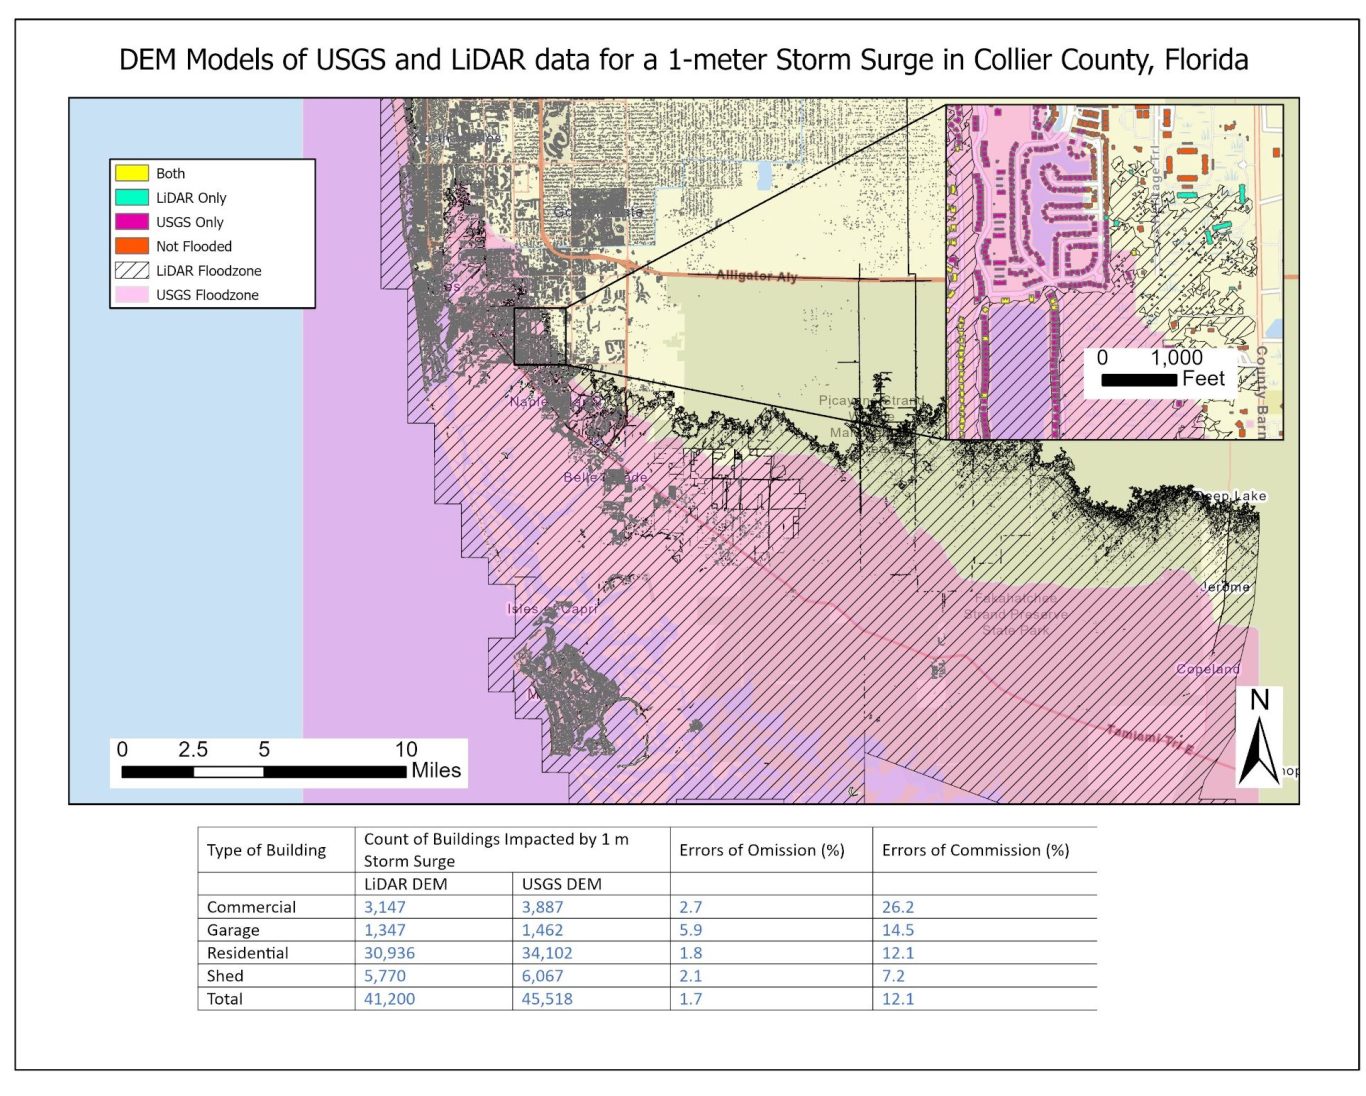
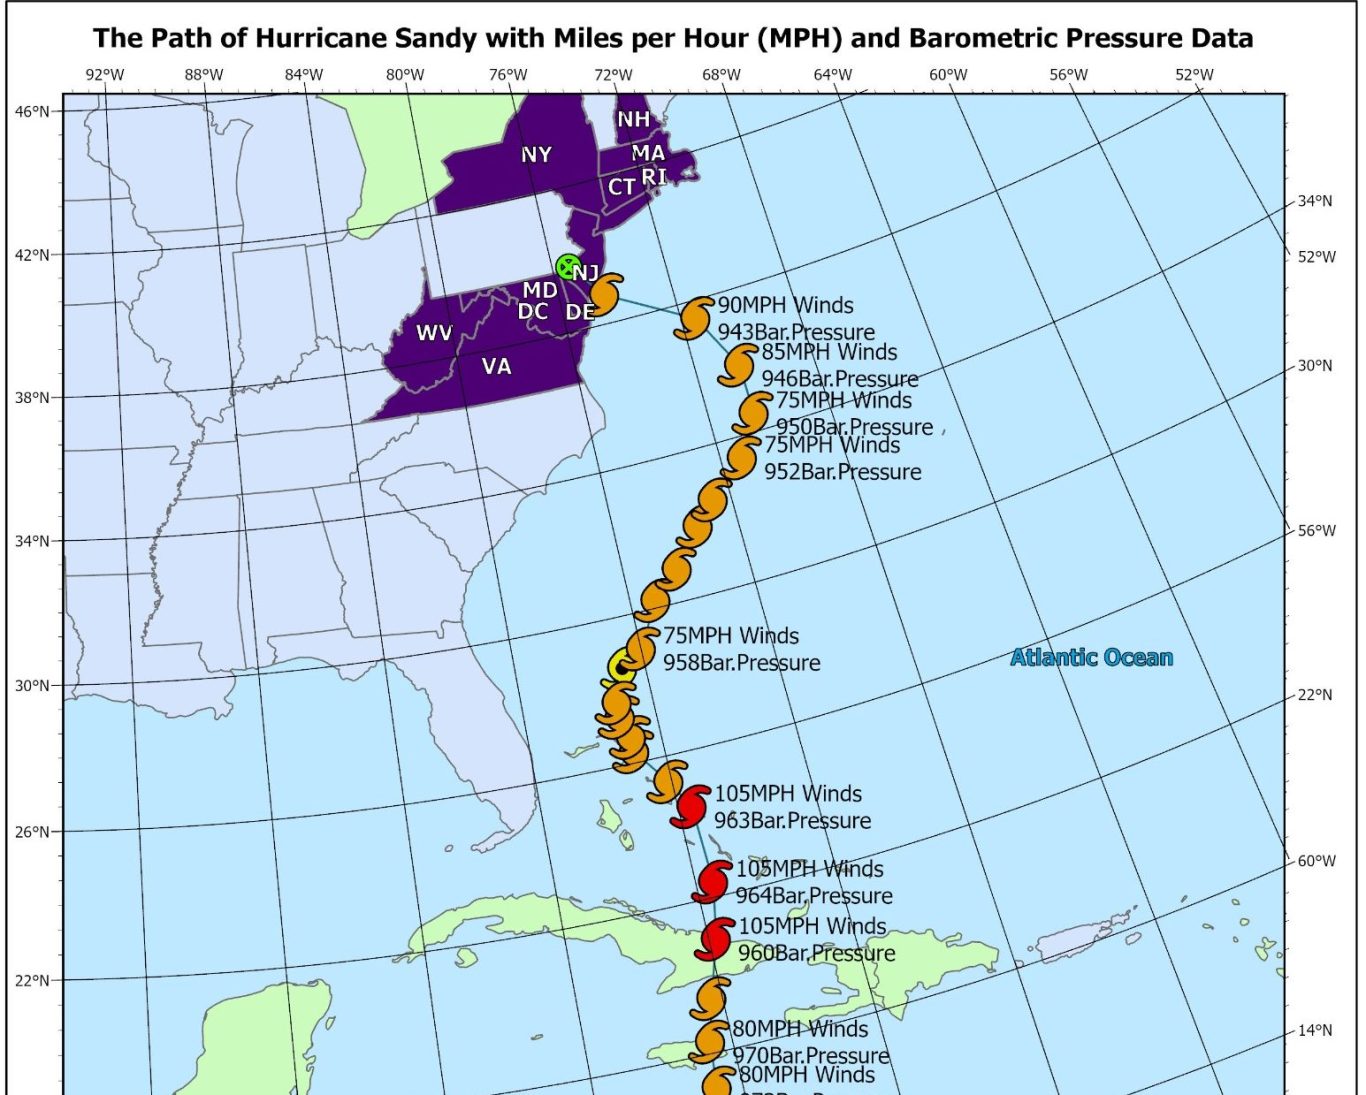
Damage Assessment
This is a look at the path of Hurricane Sandy across the Atlantic Ocean and hitting landfall on the East Coast of America.
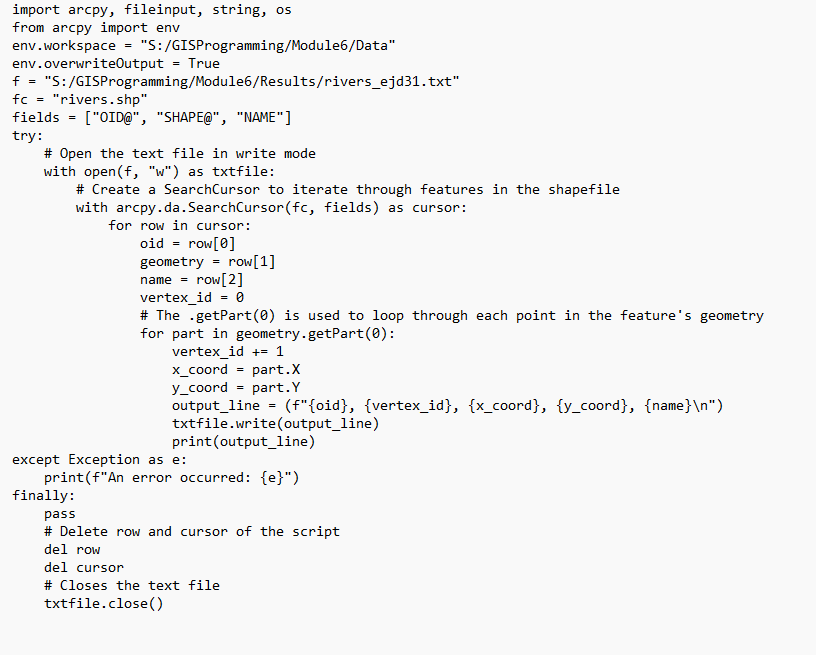
Sample of a Python Script
This script is used to create a search cursor to write over shapefile geometries, write vertices of a geometry to a text file, and contrast the different objects by using parsing over geometries .